Software
DATA VISUALIZATION IN THE CloudFM APP
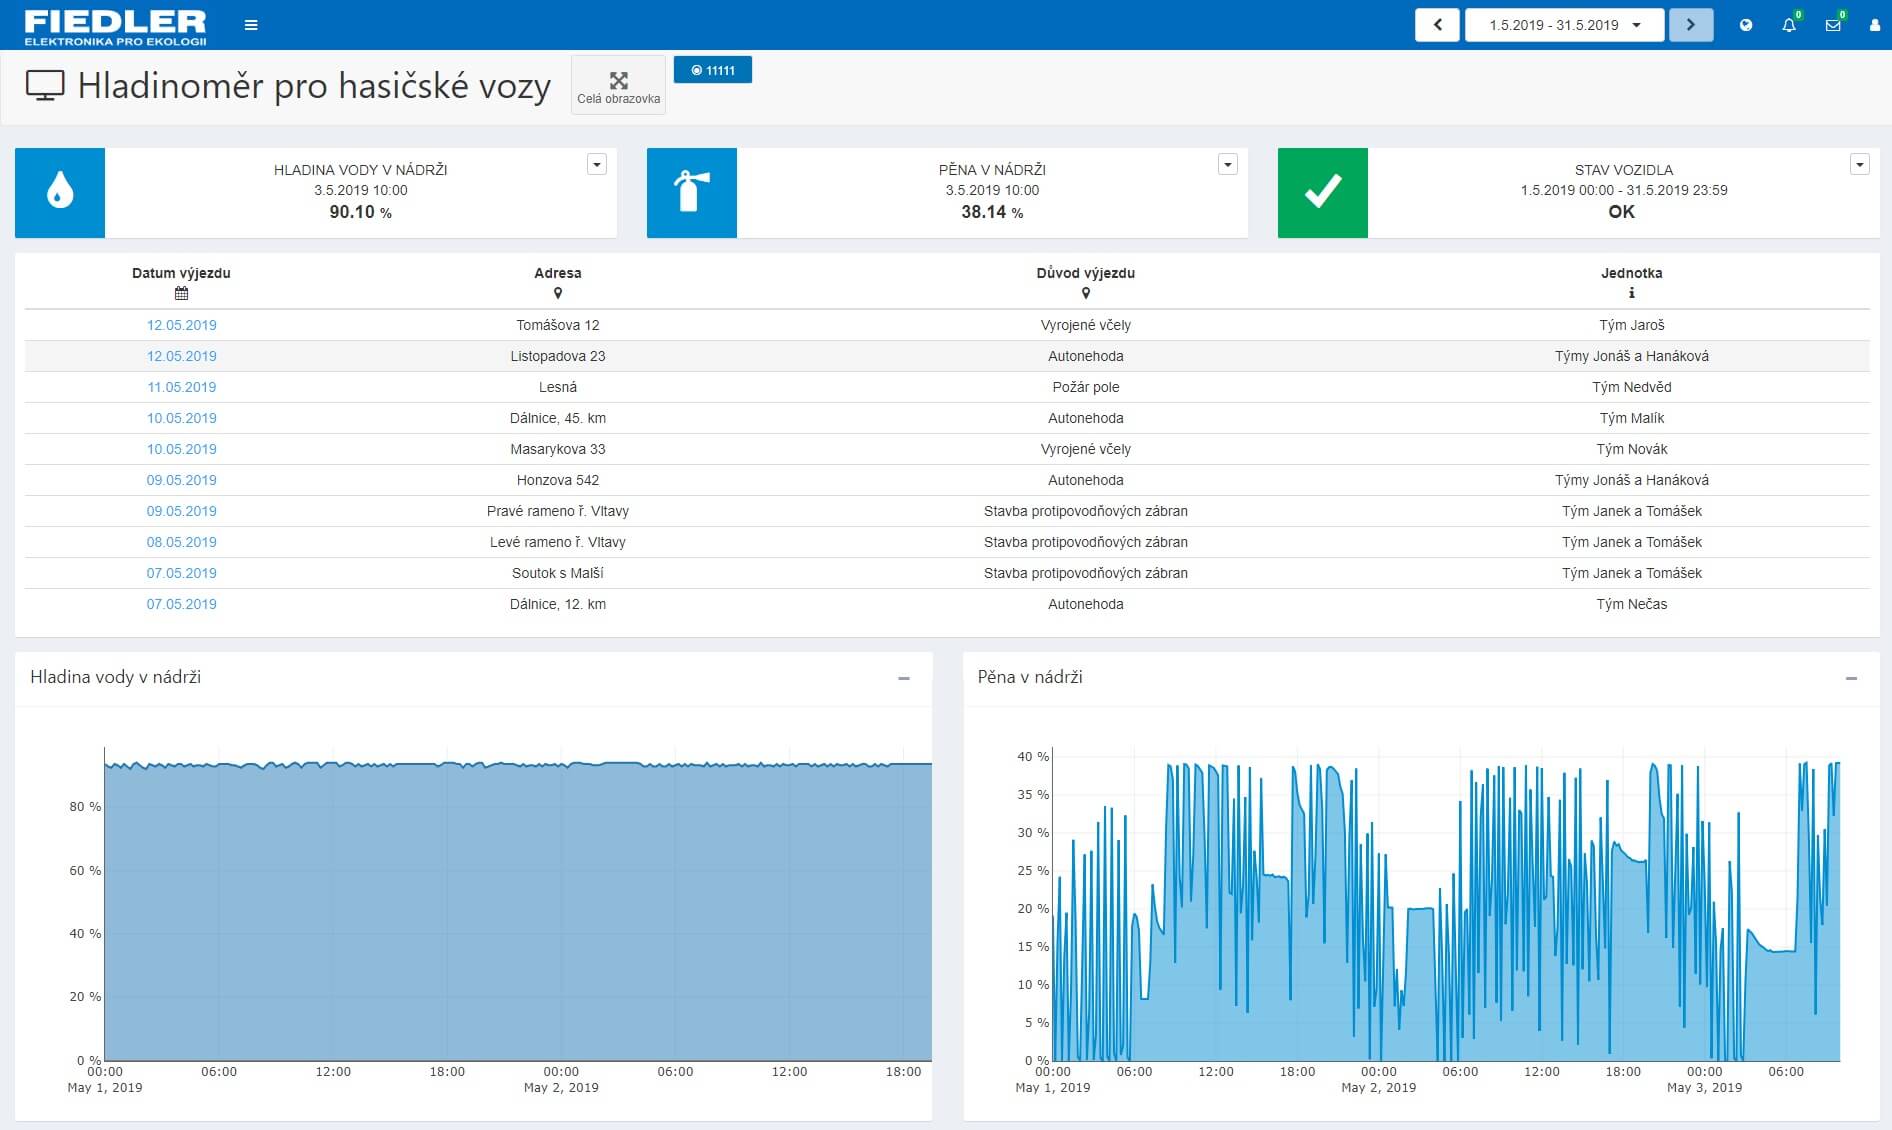
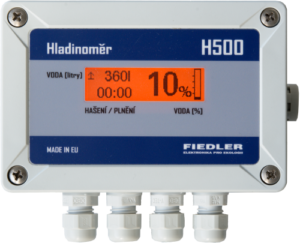
The app is connected to a level sensor that collects data on the status of a fire truck’s water tank; this data is then uploaded to a server and archived in a database that users can access via a web browser. The app monitors every connected tank and then compiles the collected data into statistics; as a user, you can view this data all in one place in a visually appealing format through graphs and tables. This allows you to quickly and easily determine the current water volume in the tanks of all fire trucks, as well as the time required to fill and empty them, the frequency of use, and total consumption. The app also supports exporting data to several formats. All of this operates in an easy-to-use interface that you can manage from a computer, smartphone, or tablet.