Overview reports working-out and printing
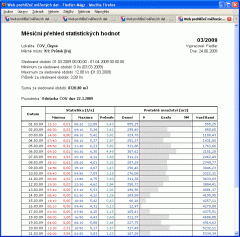
Very useful and frequently used function of data hosting is automatically creating of monthly tablets which contain daily flows, daily minimal and maximal values, etc. The user is getting a full report about an annual flow by printing 12 months statistics.  The printing is programable and monthly data can be quickly and easily changed by pressing the only one button "moving to the previous month" or "moving to the next month". On the each month overview can by a total flow, minimal and maximal values, time period, and so on.
Tablet configuration for printing:
- In the station main page choose the requested month in the area of the statistic
- Press the button “Tablets”
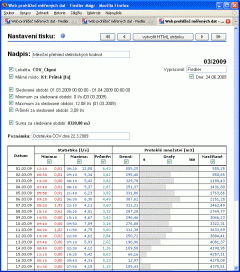
- Entries of head and column of tablet can be chosen by check boxes
- Press the button “ Balancing tablet printing”
Four buttons (previous/next calendar month, previous/next chosen period) are used for moving between displayed time periods. The web browser remembers the last situation. Configuration of the printing is intuitive.
The page is generated by button “Create HTML page”. In a newly opened page press “File” and “Printing” for printing.
Main menu
- Solutions
- Tap water treatment
- Dispatching accessible via the Internet
- Remote water meter reading
- Monitoring of water leak
- Measurement of qualitative water parameters
- Measurement in Water Supply Network
- Pressures and flows regulation
- Controlling of water pumps and water reservoirs
- Controlling technology of waste purification plants
- Flow processing into charts
- Waste water treatment
- Monitoring of running and technology of WWTP
- Control technology of WWTP
- Measurement of waste water flow
- Dissolved oxygen measurement and aeration blowers control
- Measurement of chemical parameters of water
- Local control of pumping stations
- Remote control of pumping stations
- Root zone waste water treatment plants
- Dispatching accessible via the Internet
- Processing of measured flow data
- Water level monitoring
- Flood warning system
- Environmental monitoring
- Water level and flow monitoring in small water-courses
- Temperature measurement in bore holes and water basins
- Monitoring of soil humidity and temperatures
- Measurement of rain-fall quantity and intensity
- Level measurement in boreholes and remote data collecting
- Measurement of water temperature and conductivity in boreholes
- Measurement of well yield – pumping tests
- Water-level regulation in boreholes
- Capacity and intensity of drainage water
- Thermal balance in ecological constructions
- Meteorological stations
- Relative humidity and air temperature, rainfall, global radiating, atmospheric pressure, speed and direction of wind
- Satellite transfer while the GSM signal is unavailable
- Meteorological stations for agriculture and research institutes
- Extension of meteorological stations about special sensors
- Different type of tower constructions
- Data transfers into the Internet
- Special kinds of graphs for visualization
- Irrigation control systems
- Data collecting and processing
- Data hosting on the server
- Software MOST
- Parameterization of stations via the Internet
- Transferring of measured data into a current dispatcher programme
- Visualization and processing of data
- Data exports from the server into the PC
- Overview reports working-out and printing
- An automatic emails sending
- Types of SIM cards
- Operating costs of the telemetric station
- Industrial applications
- Tap water treatment
- Products
- Monitoring and control units for water supply
- Small telemetric stations and data loggers
- Smart Metering - remote meter readings
- Water level meters
- Hydrostatic level meters
- Radar level meters
- Ultrasonic level meters
- Level gauges for wells, boreholes and reservoirs
- Level float switches
- Equipment for pumping tests of boreholes and wells
- Local Warning Systems
- Flow meters for open channels
- Water quality sensors
- Meteorological stations and measuring sensors
- Accessories for control units and data loggers
- Boxes and cabinets for telemetry and control units
- Gel accumulators, batteries and backup sources
- AC power supplies and battery chargers
- Photovoltaic solar panels
- Antennas and extension cables
- Sensor cables, connectors and connecting expanders
- Communication signal converters and communication cables
- Mechanical mounting elements
- Industrial and residential water meters
- Server software and services
- References
- Support & Download
- About us
- Monitoring
- Datahosting
- OPTIMA Control unit
Data collecting and processing
- Data hosting on the server
- Software MOST
- Parameterization of stations via the Internet
- Transferring of measured data into a current dispatcher programme
- Visualization and processing of data
- Data exports from the server into the PC
- Overview reports working-out and printing
- An automatic emails sending
- Types of SIM cards
- Operating costs of the telemetric station
Related Products
no related products

